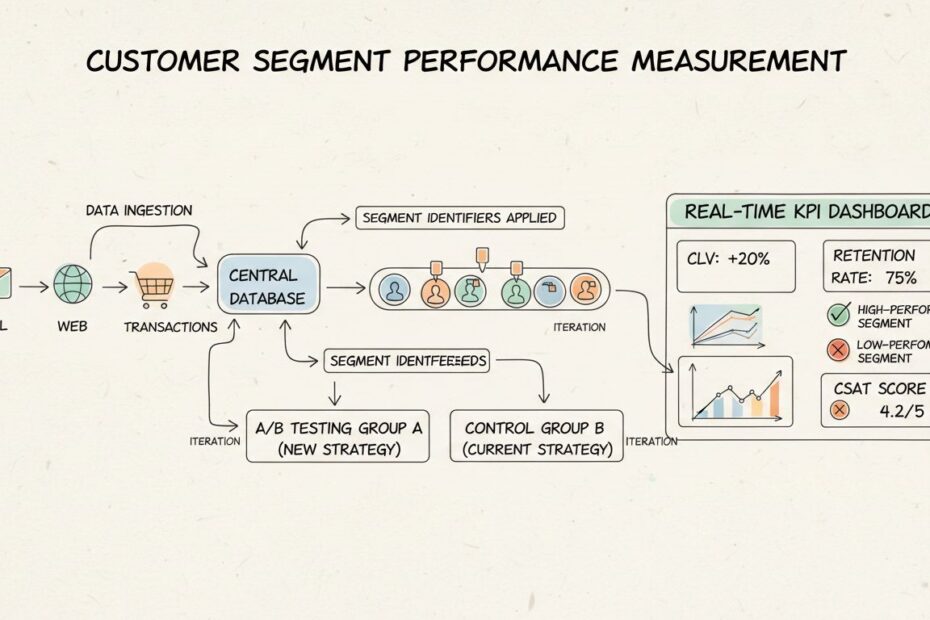
How to Measure Customer Segment Performance: A Retail Guide
Retail and e-commerce leaders routinely make critical budget and strategy decisions based on company-wide performance metrics. However, this aggregate approach masks critical performance variations within specific customer groups. When you rely solely on database-wide averages, you miss optimization opportunities that could unlock significant revenue growth.

Understanding how to measure customer segment performance is the operational foundation for converting raw customer data into actionable business decisions that drive customer lifetime value and profitability.
Why Aggregate Metrics Blind E-commerce Leaders
Company-wide metrics hide the truth about your business. If your database average shows a 3.2% conversion rate, that figure may disguise one segment converting at 8.5% while another struggles at 1.1%. Similarly, an overall customer retention rate of 42% obscures the fact that your high-value cohort retains at 68% while your acquisition-heavy segment drops to 28%. These invisible performance chasms represent lost revenue, wasted marketing spend, and strategic misalignment.
Customer segment performance measurement is the systematic evaluation of distinct audience cohorts using dedicated financial, behavioral, and experiential data points. Rather than treating your entire customer base as a monolith, you isolate each segment’s unique financial contribution, purchasing cadence, and satisfaction profile. This granular view reveals which audiences drive profitability and which require strategic intervention or retirement.
The direct commercial benefits are substantial. Precise measurement enables marketing budget reallocation away from unprofitable segments toward high-value cohorts. It prevents margin erosion by identifying segments where acquisition costs exceed lifetime value. Most importantly, it creates a structured, data-driven path to higher customer lifetime value by matching customer investment intensity to actual revenue potential.
The Core KPI Scorecard for Evaluating Customer Segments
Before implementing a measurement framework, you must understand which metrics matter at the segment level. Not every company-wide KPI translates meaningfully to segment analysis. The following metrics form the essential scorecard for evaluating customer segment performance.
Segment Customer Lifetime Value (CLV)
Segment CLV projects the total gross revenue a single customer within a specific cohort will generate over their entire relationship with your business. This metric differs fundamentally from company-wide CLV because it accounts for the unique purchasing patterns, retention rates, and expansion potential of each audience group.
To calculate segment CLV, multiply the average revenue per customer in that segment by the average customer lifetime (measured in years or months). For example, if your premium customer segment generates $450 per transaction, completes 8 transactions annually, and retains for an average of 5 years, the segment CLV is $450 × 8 × 5 = $18,000 per customer. This figure becomes your benchmark for determining whether acquisition investments in that segment make financial sense.
Segment CLV matters because it directly informs acquisition strategy. If your premium segment CLV is $18,000 but your customer acquisition cost (CAC) for that segment is $5,000, you have a healthy 3.6:1 CLV:CAC ratio. Conversely, if a secondary segment shows CLV of $2,400 but CAC of $3,200, you have a profitability problem requiring immediate attention.
Segment Customer Acquisition Cost (CAC)
Segment CAC isolates the precise sales and marketing resources spent to acquire a single member of a specific customer group. This metric is critical because acquisition efficiency varies dramatically across segments. High-value segments may justify premium acquisition channels, while cost-sensitive segments require lean, efficient acquisition tactics.
Calculate segment CAC by dividing total marketing and sales spend attributed to a segment by the number of new customers acquired in that segment during a defined period. If you spent $250,000 acquiring customers in your SMB segment and acquired 50 new customers, your segment CAC is $5,000. This figure becomes actionable only when compared against that segment’s CLV and retention profile.
Segment CAC analysis prevents budget waste by exposing acquisition channels that perform poorly for specific audiences. You may discover that paid search works efficiently for your enterprise segment (CAC $8,000) but underperforms for your mid-market segment (CAC $12,000). This insight enables channel reallocation and tactical optimization that company-wide CAC metrics would obscure.
Cohort Retention Rate
Cohort retention rate measures the percentage of customers within a specific segment who remain active buyers over defined historical intervals. Unlike simple retention calculations, cohort analysis tracks how groups of customers behave over time, revealing whether retention improves or declines as customers mature within your brand.
Cohort retention is calculated by dividing the number of customers in a segment who made a purchase in a given period by the number of customers in that segment at the start of the period. A premium e-commerce segment with 1,000 customers at the start of Q1 that retains 680 customers through Q4 shows an annual retention rate of 68%. When tracked monthly or quarterly, cohort retention reveals retention decay patterns that enable targeted intervention.
Segment-level retention analysis exposes which customer groups are most at risk. If your seasonal segment shows 45% quarterly retention while your core segment shows 72% retention, you have clear evidence that seasonal customers require different engagement strategies. This insight drives retention campaign prioritization and lifecycle messaging customization.
Average Order Value (AOV) and Purchase Frequency
Average Order Value (AOV) measures the average transaction size within a specific segment, while purchase frequency tracks how often customers in that segment buy. Together, these metrics reveal merchandising effectiveness and buying cadence within each audience group.
Calculate AOV by dividing total segment revenue by total segment transactions. If your premium segment generated $1.2 million in revenue across 2,400 transactions, the segment AOV is $500. Purchase frequency is calculated by dividing total transactions by unique customers. If those 2,400 transactions came from 300 unique customers, the purchase frequency is 8 transactions per customer annually.
AOV and frequency analysis by segment enables targeted merchandising and lifecycle optimization. If your high-value segment shows AOV of $500 but purchase frequency of only 4 times annually, you have an opportunity to increase engagement velocity. Conversely, if your volume segment shows frequency of 12 times annually but AOV of only $85, you can test product bundling and upsell tactics to increase transaction size.
Customer Satisfaction Metrics (CSAT, NPS, CES)
Customer Satisfaction Score (CSAT), Net Promoter Score (NPS), and Customer Effort Score (CES) measure experiential quality within each segment. These metrics identify friction points unique to specific customer groups and reveal whether satisfaction gaps correlate with retention or churn.
CSAT is typically measured on a 1-5 scale asking “How satisfied are you with your recent purchase?” NPS asks customers how likely they are to recommend your brand on a 0-10 scale. CES measures how easy it was for customers to resolve an issue or complete a transaction. When segmented, these metrics reveal whether premium customers experience different satisfaction levels than volume customers, or whether specific demographic groups face unique friction.
Satisfaction metrics matter because they predict churn and expansion. A segment showing high CLV but declining NPS is a warning signal that profitability is at risk. Conversely, a segment showing rising CSAT despite moderate CLV may represent an emerging opportunity for investment and expansion.
Step-by-Step Guide to Measuring Customer Segment Performance
Measurement requires operational discipline. This five-step framework guides marketing operations, analytics, and CRM teams through the implementation process.
Step 1: Assign Fixed Segment Identifiers in Your Database
Every customer profile, transactional record, and support ticket must be automatically tagged with segment attributes. This foundational step ensures that all downstream analysis captures the correct population.
Begin by defining your segment taxonomy. Determine whether you will segment by behavioral attributes (RFM: Recency, Frequency, Monetary Value), demographic characteristics (company size, industry, geography), lifecycle stage (prospect, new customer, established, at-risk), or a hybrid approach combining multiple dimensions. Document explicit inclusion and exclusion criteria for each segment so that segment membership is deterministic and reproducible.
Implement automated segment assignment in your CRM or customer data platform. Rather than manually assigning segments, configure rules-based logic that automatically tags customers based on their attributes and behaviors. For example, your premium segment might include customers with CLV greater than $15,000, purchase frequency greater than 6 annually, and retention tenure greater than 24 months. These rules should evaluate continuously so that customers move between segments as their behavior evolves.
Validate segment assignment accuracy by auditing a sample of customer records against your segment definitions. Confirm that segment sizes align with business expectations and that no customers fall outside your segment taxonomy. Document any manual exceptions and establish a process for handling edge cases.
Step 2: Establish Historical Baselines and Control Groups
Baseline metrics provide the reference point for evaluating segment performance. Control groups enable isolation of incremental impact driven by your targeted campaigns.
Calculate historical baselines for each segment by computing the five core KPIs (CLV, CAC, retention rate, AOV, and satisfaction metrics) using data from a stable historical period, typically the prior 12 months. These baselines become your performance benchmark. If your premium segment baseline shows 68% annual retention, any decline below this figure signals a problem requiring investigation.
Implement control groups for major segment-targeted campaigns. A control group is a cohort of customers who match your target segment but receive no campaign exposure. By comparing campaign recipients against matched control customers, you isolate the true incremental lift driven by your marketing efforts. For example, if your premium segment email campaign achieves a 4.2% conversion rate but your control group (similar premium customers who did not receive the email) achieves a 3.8% conversion rate, your true incremental lift is 0.4 percentage points, not the full 4.2%.
Control groups require discipline because they represent temporary foregone revenue. However, the insights they provide are invaluable. Without control groups, you cannot distinguish between lift driven by your campaign and lift driven by seasonal trends or external market conditions. Most enterprise marketing automation and CDP platforms support native control group functionality, enabling easy implementation.
Step 3: Deploy Cohort and RFM Performance Analysis
Cohort analysis groups customers by acquisition date or transaction timeline, revealing how customer behavior evolves over time. RFM analysis segments customers by Recency (time since last purchase), Frequency (purchase count), and Monetary Value (total spent), creating a simple but powerful segmentation framework.
Implement cohort analysis by creating customer groups based on acquisition month or quarter. Track how each cohort’s retention rate, AOV, and purchase frequency evolve month-by-month after acquisition. A cohort analysis table might show that Q1 2024 customers retained at 72% through month 12, Q2 2024 customers retained at 68%, and Q3 2024 customers retained at 61%. This declining retention trajectory signals either a change in customer quality or a gap in lifecycle engagement that requires intervention.
RFM analysis is calculated by assigning each customer a Recency score (1-5, where 5 = purchased in the last 30 days), a Frequency score (1-5, where 5 = 20+ purchases annually), and a Monetary score (1-5, where 5 = top 20% of spenders). Customers scoring 5-5-5 are your champions; customers scoring 1-1-1 are dormant. This framework enables rapid segmentation without requiring demographic data or complex behavioral modeling.
Deploy cohort and RFM analysis in a centralized dashboard updated weekly or monthly. This enables rapid identification of performance trends and early warning signals. If your Q1 cohort’s month-3 retention suddenly drops from historical 65% to 52%, you have evidence of a problem requiring immediate investigation.
Step 4: Layer Experience Data (NPS, CSAT, and CES)
Quantitative purchase metrics must be paired with qualitative satisfaction data to identify friction points and experience gaps within specific segments.
Integrate NPS, CSAT, and CES data into your segment performance dashboard. If possible, tag survey responses with segment attributes so that you can analyze satisfaction by customer group. A segment showing strong CLV but declining NPS may have an experience problem that threatens future retention. A segment showing rising CSAT may represent an emerging opportunity for expanded investment.
Conduct segment-specific experience audits by analyzing support tickets, product feedback, and survey comments tagged to each segment. If your enterprise segment generates disproportionate support volume relative to its size, you may have a product-market fit or onboarding problem specific to that audience. If your volume segment shows high CSAT but low NPS, customers may be satisfied with individual transactions but lack loyalty or expansion intent.
Use satisfaction data to inform retention and expansion strategies. Segments showing declining satisfaction warrant defensive retention campaigns and root-cause analysis. Segments showing rising satisfaction warrant expansion campaigns and investment in upsell and cross-sell opportunities.
Step 5: Refine, Merge, or Retire Low-Performing Segments
Segment performance measurement is iterative. Regular review and refinement ensure that your segmentation model evolves with your business and customer base.
Establish a quarterly segment performance review process. Gather marketing, sales, and customer success leadership to review segment scorecards against baseline metrics and strategic objectives. Identify segments underperforming against baseline and segments exceeding expectations. For underperforming segments, determine whether the issue is segment definition (the segment is poorly defined), messaging (the segment receives irrelevant offers), or business fundamentals (the segment is inherently unprofitable).
Merge segments that show similar performance profiles and messaging requirements. If your “emerging growth” and “growth” segments show nearly identical CLV, retention, and satisfaction metrics, they may represent unnecessary complexity. Consolidating these segments simplifies operations and enables more focused resource allocation.
Retire segments that consistently underperform and show no improvement trajectory. If a secondary segment’s CLV is $1,800 but its CAC is $2,400, and this gap persists over three consecutive quarters despite targeted optimization, the segment may warrant retirement. Retiring unprofitable segments frees resources for investment in high-value audiences.
Document all segment changes and maintain version history. This enables you to track whether segment refinements actually improve performance and ensures that all teams understand current segment definitions.
Unlocking Retail Profitability with the 80/20 Segmentation Rule
The Pareto principle, commonly known as the 80/20 rule, applies powerfully to customer segmentation. In most retail and e-commerce businesses, approximately 80% of total profits originate from roughly 20% of the customer database. This principle is not theoretical; it is empirically observable in transaction data.
Using segment performance tracking, you can isolate this critical 20% and understand precisely what makes them different. These high-value champions typically show distinct characteristics: higher CLV, better retention, lower CAC relative to lifetime value, higher AOV, and greater satisfaction. By analyzing the demographic, behavioral, and psychographic attributes of your top 20%, you can identify lookalike audiences and adjust acquisition strategies to attract similar customers.
The practical application is direct budget reallocation. If your top 20% of customers drive 80% of profit, your acquisition spend should reflect this reality. If you currently allocate acquisition budget equally across all segments, you are likely overspending on low-value audiences and underspending on high-value lookalikes. Rebalancing acquisition spend toward channels and messages that resonate with your top 20% will increase overall profitability.
Similarly, retention investment should be concentrated on your high-value segments. If your top 20% shows 75% annual retention but your bottom 50% shows 35% retention, a $100,000 retention investment may yield significantly higher ROI when deployed to protect your top 20% rather than attempting to rescue unprofitable segments.
Tools and Data You Need
Effective segment performance measurement requires three foundational capabilities: a unified customer data platform (CDP) or CRM that enables segment assignment and tracking, analytics infrastructure capable of computing segment-level KPIs, and visualization tools for segment performance dashboards.
| Capability | Purpose | Example Tools |
|---|---|---|
| Customer Data Platform or CRM | Unified customer profiles with segment attributes and behavioral data | Bloomreach Customer Data Platform, Salesforce, HubSpot |
| Analytics Database | Compute segment-level KPIs and cohort analysis | Snowflake, BigQuery, Redshift |
| Visualization and Reporting | Create segment performance dashboards and scorecards | Looker, Tableau, Mode Analytics |
| Marketing Automation | Execute segment-targeted campaigns with control groups | Bloomreach Engagement, Klaviyo, Iterable |
| Customer Feedback | Capture and segment CSAT, NPS, and CES data | Qualtrics, Delighted, SurveySparrow |
The most critical capability is a unified customer data platform that consolidates behavioral, transactional, and attribute data into complete customer profiles. Without unified data, segment assignment becomes fragmented and analysis becomes unreliable. Bloomreach’s customer data platform unifies real-time behavioral data with historical transaction records and customer attributes, enabling automated segment assignment and native performance tracking without requiring manual data engineering.
Common Challenges in Segment Performance Measurement
Data Quality and Segment Assignment Errors
Inaccurate segment assignment undermines all downstream analysis. If your segment definitions are fuzzy or if customer records are not consistently tagged, your segment performance metrics become meaningless. Common causes include manual segment assignment, inconsistent data collection across channels, and failure to update segment membership as customer behavior evolves.
Address this challenge by implementing automated, rules-based segment assignment in your CRM or CDP. Define segment criteria explicitly so that every customer either clearly qualifies or does not qualify for each segment. Audit segment membership regularly and establish data quality thresholds for segment inclusion.
Insufficient Sample Sizes
Segments that are too small generate unreliable metrics. If your “enterprise” segment contains only 12 customers, a single large transaction or churn event can skew your metrics dramatically. Small segments also lack statistical significance, making it difficult to determine whether performance changes are real or random variation.
Establish minimum sample size thresholds for segment analysis. A segment with fewer than 50-100 customers may be too small to generate reliable metrics. Consider consolidating small segments with similar characteristics or excluding them from formal analysis until they reach critical mass.
Attribution Complexity
Attributing campaign impact to specific segments becomes complex when customers interact with multiple channels and campaigns. A customer may receive an email, click a paid search ad, and visit your website before purchasing. Determining which touchpoint drove the conversion requires sophisticated attribution modeling.
Implement multi-touch attribution that distributes credit across all contributing touchpoints. Most enterprise marketing automation platforms and CDPs support multiple attribution models (first-touch, last-touch, linear, time-decay). Select a model that aligns with your business logic and apply it consistently across all segments.
Seasonal and External Volatility
Seasonal trends and external market events can distort segment performance metrics. If your retail segment shows declining retention in Q4, is this a real problem or simply seasonal holiday shopping behavior? External events like supply chain disruptions or competitive launches can also temporarily depress segment performance.
Address volatility by comparing segment performance to historical seasonal patterns and by establishing control groups that isolate the impact of external events. Track performance over multiple years to establish seasonal baselines. When external events occur, use control groups to measure their impact on segment performance.
How to Measure Success
Segment performance measurement is successful when it drives measurable changes in business outcomes. Success is not simply having a dashboard; success is using that dashboard to make better decisions.
Track the following outcome metrics to measure the success of your measurement implementation:
Improved segment-targeted campaign performance: Campaigns targeted to high-performing segments should show higher engagement and conversion rates than campaigns targeting low-performing segments. If your premium segment campaigns convert at 3.2% while your volume segment campaigns convert at 1.8%, your segmentation is working.
Increased allocation efficiency: The percentage of marketing spend allocated to high-CLV segments should increase over time as you identify and refine your best customers. If you reallocate 20% of acquisition spend from low-CLV to high-CLV segments, your blended CAC should decline and your blended CLV:CAC ratio should improve.
Improved retention in targeted segments: Segments receiving focused retention campaigns should show retention improvement relative to control groups. If your at-risk segment receives a targeted win-back campaign and retention improves from 35% to 42%, your retention investment is working.
Revenue lift from segment optimization: Overall revenue should increase as you concentrate resources on high-performing segments and retire unprofitable ones. Track total revenue, segment-specific revenue, and revenue per customer to measure the impact of your segmentation refinements.
Reduced customer acquisition cost: As you refine your acquisition strategy to focus on high-value lookalikes, your blended CAC should decline. If you reduce CAC by 15% while maintaining customer quality, you have successfully optimized acquisition efficiency.
How Voxwise Can Help
Measuring customer segment performance requires both technical infrastructure and strategic expertise. Voxwise partners with retail and e-commerce brands to design robust data tracking layer blueprints, construct automated segment scorecards, and optimize lifecycle automation workflows that convert performance metrics into clear revenue growth.
Voxwise specializes in customer data activation and CRM implementation for retail enterprises. Our team helps you establish unified customer data foundations, define segment taxonomies aligned with business strategy, implement automated segment assignment logic, and build segment performance dashboards that enable rapid decision-making. We work with leading platforms including Bloomreach to ensure that your customer data infrastructure supports advanced segmentation and real-time performance tracking.
Our approach is operationally focused. Rather than delivering reports, we help you build internal capabilities to measure, analyze, and optimize segment performance continuously. We establish segment review processes, train your team on cohort analysis and RFM methodology, and help you translate performance insights into actionable marketing, sales, and product decisions.
If your current segmentation infrastructure lacks real-time performance visibility, if you struggle with segment assignment accuracy, or if you want to unlock the profitability potential of your top 20% of customers, Voxwise can help you build a measurement framework that drives sustainable revenue growth.
Conclusion
Customer segment performance measurement is not optional for retail and e-commerce leaders seeking competitive advantage. Relying on aggregate metrics blinds you to critical performance variations within specific customer groups. By implementing the five-step measurement framework outlined in this guide, you gain the visibility and precision necessary to allocate resources to your most profitable audiences, prevent margin erosion, and drive sustainable customer lifetime value growth.
The measurement process begins with assigning fixed segment identifiers, establishing baselines and control groups, deploying cohort and RFM analysis, layering experience data, and continuously refining your segment model. The core KPI scorecard of CLV, CAC, retention, AOV, and satisfaction metrics provides the operational foundation for decision-making. The 80/20 principle reveals that your top 20% of customers likely drive 80% of profit, making these audiences your highest-priority investment targets.
Start by auditing your current segmentation infrastructure. Confirm that your CRM or CDP can support automated segment assignment and that you have the analytics capability to compute segment-level KPIs. Establish baseline metrics for your current segments and implement control groups for your next major campaign. Build your segment performance dashboard and schedule quarterly reviews to refine your model based on actual results.
The brands that master segment performance measurement will systematically outperform those relying on aggregate metrics. The competitive advantage belongs to those who understand exactly which customers drive profit and who have the operational discipline to continuously refine their segmentation strategy based on data.
Frequently Asked Questions
What is customer segment performance measurement?
Customer segment performance measurement is the systematic evaluation of distinct customer cohorts using dedicated financial, behavioral, and satisfaction metrics. Rather than relying on company-wide averages, segment measurement isolates each audience group’s CLV, retention rate, acquisition cost, and satisfaction profile to enable precise resource allocation and strategic optimization.
How do you measure the effectiveness of a customer segmentation model?
Segmentation effectiveness is measured by comparing segment-level performance against clear baselines and control groups. Effective segments show statistically meaningful gaps in engagement, conversion, and revenue. Segments must be stable enough to target, different enough to treat uniquely, and profitable enough to justify targeted investment.
Why should you use control groups when evaluating segment performance?
Control groups isolate the incremental impact of your segment-targeted campaigns by comparing campaign recipients against matched customers who did not receive the campaign. Without control groups, you cannot distinguish between lift driven by your campaign and lift driven by seasonal trends or external market conditions.
What is the difference between database-wide KPIs and segment-specific KPIs?
Database-wide KPIs measure performance across your entire customer base, masking critical variations within specific groups. Segment-specific KPIs measure performance within each audience cohort, revealing which segments are profitable and which require intervention. Segment metrics enable precise resource allocation; database-wide metrics hide optimization opportunities.
Ready to Master Segment Performance Measurement?
Improve your customer segment performance measurement with expert guidance from Voxwise.
Request a 30-Minute Customer Engagement Consultation to discuss your segmentation and personalization strategy with our team.
Get a CRM Maturity Check to understand where your current capabilities stand and what optimization opportunities exist.
Check Your Bloomreach Setup if you already have the platform in place and want to optimize execution.