
How to Identify At-Risk Customers
Identifying at-risk customers means spotting accounts most likely to stop buying, cancel subscriptions, reduce engagement, or churn before they actually leave. A practical approach combines behavioral signals, customer feedback, and predictive scoring to catch problems early and intervene with targeted retention strategies.
Understanding At-Risk Customers
At-risk customers are those poised to disengage, reduce spending, or leave your company entirely. Unlike customers who churn suddenly, at-risk accounts typically show warning signs weeks or months in advance. These signals appear across product usage, financial activity, support interactions, and customer sentiment. By monitoring these indicators, customer success teams can identify vulnerable accounts and take proactive steps to strengthen relationships before revenue is lost.
Churn is particularly costly in subscription and SaaS businesses where customer lifetime value depends on retention. A single lost account can represent months or years of lost recurring revenue. This makes early identification of at-risk customers one of the highest-impact activities a customer success team can perform.
Key Warning Signs of At-Risk Customers
Declining Product Usage
Usage decline is often the strongest predictor of churn. When customers use your product less frequently or abandon key features, they’re signaling that they’re not finding sufficient value. Monitor these metrics closely:
- Fewer logins or sessions: A drop in how often customers access your platform
- Reduced feature adoption: Customers stop using important capabilities they previously relied on
- Lower transaction frequency: Fewer purchases, API calls, or interactions over time
- Extended inactivity periods: Long gaps between last activity and current date
- Declining daily/monthly active users (DAU/MAU): The ratio of active users shrinks relative to total licensed users
A sharp negative change in engagement—particularly a 30% or greater drop over 30–90 days—is a red flag that warrants immediate outreach.
Reduced Financial Activity
Financial signals reveal whether customers are still investing in your solution:
- Smaller order sizes: Customers purchase less frequently or in smaller quantities
- Service downgrades: Moving from premium to basic plans or reducing seat counts
- Payment delays or failures: Late payments, declined cards, or failed renewal attempts
- Switching from annual to monthly billing: A sign customers are hedging their commitment
- Lower API usage or license utilization: Customers aren’t using the full scope of their subscriptions
In B2B SaaS, watch for reductions in active seats, API calls, or concurrent users—these often precede cancellations by weeks.
Support Ticket Patterns
Customer support data is a goldmine for churn prediction. At-risk customers often exhibit two extreme behaviors:
- Support escalation: Frequent complaints, unresolved issues, or tickets reopened multiple times
- Radio silence: Customers who stop contacting support entirely after initial engagement
Track these support metrics: ticket volume spikes, average resolution time, customer satisfaction (CSAT) decline, and Net Promoter Score (NPS) drops. A customer with consistently low CSAT or NPS is significantly more likely to churn.
Negative Sentiment and Feedback
Listen to what customers are saying across all channels:
- Survey responses: NPS scores below 0, CSAT below 70%, or qualitative feedback mentioning dissatisfaction
- Email and chat sentiment: Language expressing frustration, complaint, or resignation
- Competitor mentions: Customers discussing alternative solutions or comparing your product unfavorably
- Price objections: Repeated comments about cost or value
- Feature gaps: Customers highlighting missing capabilities as deal-breakers
Negative sentiment is a strong indicator that a customer is evaluating alternatives and may leave at renewal time.
Lifecycle and Contract Timing
Certain business moments increase churn risk:
- Renewal windows: Customers are most likely to churn at contract renewal
- End of onboarding: If customers haven’t achieved time-to-value, they may not renew
- Pricing changes: Rate increases trigger re-evaluation of ROI
- Organizational changes: Executive sponsor departure, team restructuring, or budget cuts
- Seasonal budget cycles: End of fiscal year or budget freeze periods
For B2B accounts, watch for stakeholder changes—when your champion leaves the company or loses influence, account risk increases significantly.
Building an At-Risk Scoring Model
A customer health score consolidates multiple signals into a single metric, making it easy to identify at-risk accounts at a glance. Here’s a practical framework:
| Signal | Weight | Measurement |
|---|---|---|
| Usage Decline | 35% | % change in logins, features used, or transactions |
| Support Complaints | 20% | Ticket volume, escalations, CSAT score |
| Payment Issues | 15% | Late payments, failed renewals, downgrades |
| NPS/CSAT Decline | 20% | Negative sentiment in surveys or feedback |
| Renewal Proximity | 10% | Days until contract renewal |
Calculate health scores on a 0–100 scale:
- 80–100: Healthy account—low churn risk
- 50–79: Moderate risk—monitor closely and consider outreach
- Below 50: High risk—immediate intervention recommended
Normalize each metric to a 0–100 scale before applying weights. For example, if usage declined 40%, that might score 60/100 (meaning 40% risk). Multiply by the weight (35%) and sum across all signals.
High-Impact Predictive Metrics by Business Model
For SaaS and Subscription Businesses
- Weekly active users (WAU): Trend over 12 weeks
- Feature adoption depth: Number of distinct features used per account
- Time-to-value: Days to first meaningful usage; longer = higher churn risk
- Seat utilization: Percentage of licensed seats actually used
- Renewal likelihood score: Predictive model trained on historical churn data
For E-Commerce and Retail
- RFM analysis (Recency, Frequency, Monetary): Combines purchase recency, purchase frequency, and total customer value
- Cart abandonment rate: High rates indicate friction or lost interest
- Repeat purchase interval: Increasing gaps between orders suggest declining engagement
- Average order value (AOV) trend: Declining AOV may precede churn
- Customer lifetime value (CLV) projection: Declining CLV indicates at-risk status
For B2B and Enterprise Accounts
- Stakeholder engagement: Number of active users and their department diversity
- Expansion activity: New use cases, departments, or product modules adopted
- Training and onboarding completion: Customers who complete training are more likely to stay
- Executive involvement: C-level engagement in check-ins and strategic reviews
- Support ticket sentiment: Tone and urgency of support interactions
Practical Retention Strategies Using Data
Cohort Analysis for Pattern Recognition
Analyze historical churn data to identify patterns. Compare customers who churned versus those who stayed, looking for behavioral differences 30–90 days before churn:
- Which onboarding milestones correlate with retention?
- Which features have the strongest correlation with staying?
- Which customer segments have the highest churn rates?
- What support interactions precede churn versus retention?
Use these insights to create targeted interventions. For example, if customers who complete a specific training module have 40% lower churn, prioritize that training for all new accounts.
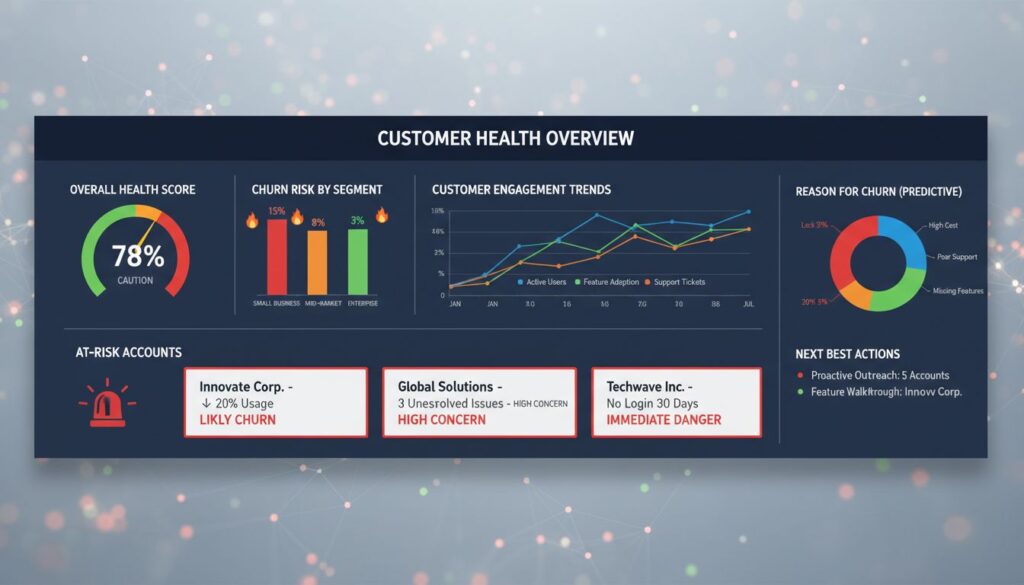
Building an Early Warning Dashboard
Create a real-time dashboard that your customer success team monitors daily:
- Health score trend: Visual indicator of account health over time
- Last activity date: Days since last login or engagement
- Renewal date: Days until contract renewal with color-coded urgency
- Open support tickets: Count and priority level
- NPS/CSAT history: Recent survey responses and trend
- Product usage trend: 30-day, 90-day, and 12-month usage graphs
- Revenue at risk: Total ARR of all flagged accounts
Automated alerts should trigger when accounts drop below health score thresholds, ensuring your team responds quickly.
Bloomreach: The Platform for Proactive Customer Engagement
Identifying at-risk customers is only the first step—you must then engage them with the right message at the right time. This is where Bloomreach Engagement, a unified customer data platform (CDP) and marketing automation solution, becomes invaluable.
Bloomreach enables businesses to:
- Unify customer data: Consolidate behavioral, transactional, and support data into a single customer view, making at-risk signals visible across teams
- Real-time segmentation: Automatically identify and segment at-risk customers based on health scores and behavioral triggers
- Omnichannel campaigns: Reach at-risk customers via email, SMS, in-app messaging, and push notifications with personalized retention offers
- Predictive analytics: Use AI to identify churn risk before it becomes critical and score customers by likelihood to convert
- Personalized customer journeys: Deliver tailored content, product recommendations, and support offers based on each customer’s specific risk factors
- Campaign automation: Trigger retention workflows automatically when customers hit at-risk thresholds, ensuring no opportunity is missed
- Real-time personalization: Adjust messaging and offers in real-time as customer behavior changes
For e-commerce and retail brands, Bloomreach’s e-commerce personalization capabilities help recover lost customers through targeted product recommendations and retention campaigns. For SaaS companies, customer engagement automation enables proactive outreach before churn happens.
By combining health scoring with Bloomreach’s unified CDP and marketing automation, businesses can move from reactive support to proactive retention. Voxwise partners with leading brands to implement and optimize Bloomreach, ensuring your at-risk customer identification strategy translates into measurable retention improvements and revenue recovery.
Frequently Asked Questions
What is the most reliable indicator of customer churn?
Behavioral change is the strongest predictor. A significant decline in product usage—particularly a 30% or greater drop over 30–90 days—is more predictive than absolute activity level. Combine this with support sentiment and financial signals for highest accuracy.
How often should we calculate customer health scores?
Calculate health scores weekly or bi-weekly for active monitoring. For accounts approaching renewal, calculate daily. Real-time scoring is ideal if your infrastructure supports it, but weekly updates are sufficient for most businesses to identify at-risk accounts in time for intervention.
Should we reach out to all at-risk customers the same way?
No. Segment at-risk customers by risk reason and account value. A customer declining usage needs different outreach than one with payment issues or negative sentiment. Tailor your message to address the specific risk factor. High-value accounts warrant personalized outreach; lower-value accounts may benefit from automated campaigns.
How can we prevent at-risk customers from churning?
Intervene quickly with targeted support, training, or product adjustments. Offer discounts or service additions for price-sensitive customers. Reconnect with disengaged customers through personalized campaigns highlighting underused features or new capabilities. For strategic accounts, escalate to leadership for relationship repair.
What role does AI play in identifying at-risk customers?
Machine learning models (logistic regression, random forests, gradient boosting) can predict churn probability more accurately than rule-based scoring, especially with large historical datasets. AI identifies non-obvious patterns and weights signals dynamically. Start with simple rule-based scoring; graduate to AI-driven models once you have 12+ months of historical data.
How do we measure the success of our at-risk customer program?
Track: churn rate reduction, revenue recovered from saved accounts, time-to-intervention, and intervention success rate. Compare churn rates for flagged accounts that received outreach versus those that didn’t. Calculate the ROI of your retention efforts by dividing recovered revenue by program costs.
Ready to Reduce Churn and Protect Revenue?
Identifying at-risk customers is critical, but turning that insight into action requires the right tools and expertise. Voxwise helps leading brands implement customer engagement strategies powered by Bloomreach, enabling proactive retention, personalized customer journeys, and measurable revenue protection.
Whether you’re building your first health scoring model or optimizing a mature retention program, our team of customer success and CDP experts can help you move from reactive to proactive customer management.