Customer Retention Metrics Every E-commerce Brand Should Track
Customer retention metrics are the quantifiable indicators that reveal how well your e-commerce brand keeps customers coming back for repeat purchases, how long they remain active, and how much revenue they generate over their entire relationship with your business. While many e-commerce brands focus heavily on customer acquisition—spending significant marketing budgets to attract new customers—the data tells a compelling story: 65% of company revenue comes from repeat customers, and increasing retention by just 5% can boost profits by 25% to 95%.

This dramatic difference in profitability makes tracking the right retention metrics absolutely critical to building a sustainable, profitable e-commerce business. Without visibility into these metrics, you’re essentially flying blind, unable to identify which customers are at risk of churning, which cohorts drive the most profit, or where to invest your limited resources for maximum return.
Why E-commerce Brands Must Prioritize Retention Metrics
The economics of e-commerce have fundamentally shifted in recent years, making retention more important than ever before. Customer acquisition costs continue to rise as competition intensifies and advertising channels become more expensive, with brands now losing an average of $29 per newly acquired customer. Meanwhile, acquiring a new customer costs 5 to 25 times more than retaining an existing one, creating a stark economic reality: you cannot build a profitable, sustainable e-commerce business by constantly chasing new customers. Repeat customers, by contrast, are significantly more valuable than one-time buyers. They spend more per transaction, purchase more frequently, require less marketing investment, and become brand advocates who drive referrals at minimal cost.
Research shows that while repeat customers make up only 8% of your customer base, they contribute 40% of annual revenue—a disproportionately high contribution that underscores their strategic importance. Furthermore, loyal customers are more forgiving of occasional service issues, more likely to try new products, and more willing to pay premium prices. By tracking and optimizing retention metrics, you shift from a costly acquisition-focused model to a sustainable, profitable retention-focused model that builds long-term business value.
The Seven Core Retention Metrics Every E-commerce Brand Must Track
| Metric | What It Measures | Why It Matters | Target Range |
|---|---|---|---|
| Customer Lifetime Value (CLV) | Total revenue a customer generates throughout their entire relationship | Determines how much you can spend on acquisition and still be profitable | $150-$500+ depending on industry |
| Repeat Purchase Rate (RPR) | Percentage of customers who make more than one purchase | Indicates product-market fit and post-purchase marketing effectiveness | 20-40% is healthy; 50%+ is excellent |
| Customer Retention Rate (CRR) | Percentage of customers who continue buying over a specific period | Shows how well you’re keeping existing customers engaged and minimizing churn | 85-95% annually is strong |
| Customer Churn Rate | Percentage of customers who stop buying during a period | Identifies how fast you’re losing customers and where problems exist | Below 5% monthly is healthy |
| Average Order Value (AOV) | Average amount spent per transaction | Higher AOV increases revenue per customer and often correlates with stronger retention | $40-$150+ depending on industry |
| Net Promoter Score (NPS) | Likelihood of customers recommending your brand to others | Predicts future retention and identifies satisfaction issues before customers leave | 50+ is excellent; 30+ is good |
| Customer Engagement Score (CES) | How actively customers interact with your brand across channels | Reveals which customers are most engaged and likely to remain loyal | Higher engagement = higher retention |
Customer Lifetime Value (CLV): Your Most Important Metric
Customer Lifetime Value represents the total revenue a customer generates throughout their entire relationship with your brand, making it arguably the single most important retention metric for e-commerce. CLV answers the fundamental question: “How much is each customer worth to my business?” This number directly determines how much you can spend on customer acquisition, how much you should invest in retention, and which customers deserve VIP treatment. The average e-commerce CLV stands at $168, but this varies dramatically by industry, product category, and business model. A luxury goods retailer might have a CLV of $2,000+, while a fast-moving consumer goods brand might have a CLV of $50-$100. Surprisingly, while 89% of companies acknowledge CLV’s importance, only 42% measure it accurately, leaving significant opportunity for those who get it right.
There are two primary methods to calculate CLV. The historical method adds up all past purchases for an existing customer relationship, providing a precise number for customers already in your database. The predictive method estimates future revenue by multiplying average order value by the predicted number of orders and customer lifespan, allowing you to forecast CLV for new customer cohorts. To increase CLV, introduce loyalty programs (which drive an 80% positive ROI), focus obsessively on customer experience (86% of customers are willing to spend more for better experience), and continuously deliver new products and value that encourage repeat purchases and larger order values.
Repeat Purchase Rate (RPR): The Loyalty Indicator
Repeat Purchase Rate measures the percentage of your total customer base that has made more than one purchase, serving as a direct indicator of product-market fit and the effectiveness of your post-purchase marketing efforts. For most e-commerce businesses, a healthy RPR falls between 20% and 40%, with anything above 50% indicating exceptional loyalty and customer satisfaction. The 60-day repeat purchase rate is particularly predictive of long-term loyalty, as customers who return within 60 days are significantly more likely to become repeat buyers.
To improve RPR, focus on excellent onboarding that helps customers quickly realize product value, implement strategic post-purchase email sequences that encourage reorders, offer loyalty programs that reward repeat purchases, and maintain consistent product quality that gives customers reasons to come back. Many successful e-commerce brands use trigger-based emails—such as “time to reorder” messages for consumable products or “we miss you” campaigns for customers who haven’t purchased recently—to gently nudge customers back into the purchase cycle.
Customer Retention Rate (CRR): Your Core Health Metric
Customer Retention Rate measures the percentage of customers who continue to buy from your brand over a specific time period, typically calculated monthly or annually. A strong annual CRR of 85-95% indicates that you’re successfully keeping customers engaged and minimizing churn in a highly competitive online market. To calculate CRR, use this formula: CRR = ((Ending Period Customers – New Customers Acquired) ÷ Beginning of Period Customers) × 100.
For example, if you started a quarter with 1,000 customers, ended with 1,100 customers, and acquired 200 new customers, your CRR would be 75%, meaning you retained 75% of your original customer base. CRR differs from RPR in that CRR measures whether customers remain active (even if they haven’t purchased recently), while RPR specifically measures those who have made repeat purchases. Both metrics are valuable: RPR reveals how many customers are actively repurchasing, while CRR reveals how many customers remain engaged with your brand overall.
Customer Churn Rate: Identifying Your Leaks
Customer Churn Rate measures the percentage of customers who stop doing business with you during a given time period, serving as the inverse of retention rate. If your CRR is 85%, your churn rate is 15%. A monthly churn rate below 5% is generally considered healthy, though this varies by industry and business model. High churn signals underlying problems—poor product quality, misaligned customer expectations, inadequate customer service, or lack of engagement.
By identifying which customer segments have the highest churn rates, you can diagnose root causes and implement targeted interventions. For example, if customers acquired through a particular paid advertising channel have 40% churn while organic customers have 10% churn, that signals a mismatch between advertising messaging and actual product experience. Similarly, if customers who never engage with onboarding emails churn at 50% while engaged customers churn at 5%, that reveals the importance of effective onboarding.
Average Order Value (AOV): Maximizing Revenue Per Customer
Average Order Value measures the average amount customers spend per transaction, calculated by dividing total revenue by total number of orders. While AOV isn’t strictly a loyalty metric, it directly correlates with retention because customers who spend more per transaction tend to be more engaged and loyal. Increasing AOV by even $5-$10 per order dramatically increases lifetime value and profitability.
Proven strategies to increase AOV include product bundling (offering complementary products together at a slight discount), free shipping thresholds (encouraging customers to add items to reach free shipping), tiered loyalty rewards (giving customers incentives to spend more to reach higher tiers), and personalized product recommendations (suggesting higher-priced items based on purchase history). For example, a brand with 10,000 customers, $50 average AOV, and 30% repeat purchase rate could increase revenue by $150,000 annually by increasing AOV to just $55 per order.
Net Promoter Score (NPS): Measuring Advocacy and Satisfaction
Net Promoter Score measures customer willingness to recommend your brand to friends or family, calculated by asking customers “How likely are you to recommend us?” on a 0-10 scale. Customers who respond 9-10 are promoters (loyal advocates), 7-8 are passives (satisfied but not enthusiastic), and 0-6 are detractors (dissatisfied customers who may actively discourage others). NPS = (% Promoters – % Detractors).
An NPS above 50 is excellent, 30-50 is good, and below 30 indicates significant satisfaction issues. NPS serves as an early warning system for churn—detractors are significantly more likely to stop buying from you, while promoters are significantly more likely to remain loyal. The power of NPS lies in its predictive value: customers with high NPS today are likely to have high CLV and low churn tomorrow. By regularly measuring NPS and closing the feedback loop with detractors (asking why they’re unsatisfied and addressing their concerns), you can prevent churn before it happens.
Customer Engagement Score (CES): Predicting Future Behavior
Customer Engagement Score is a composite metric that measures how actively customers interact with your brand across all channels—email opens, website visits, app usage, social media engagement, customer service interactions, and more. Customers with high engagement scores are significantly more likely to remain loyal and make repeat purchases, while disengaged customers are at high churn risk.
To calculate CES, assign point values to different engagement actions (email opens = 1 point, website visit = 2 points, purchase = 10 points, etc.), then sum points for each customer over a defined period. Customers with high CES scores deserve personalized, VIP treatment and proactive outreach, while low-engagement customers need re-engagement campaigns designed to remind them of your value proposition and encourage them to interact with your brand.
Advanced Retention Metrics for Deeper Insights
Beyond the core seven metrics, sophisticated e-commerce brands track additional advanced metrics that reveal deeper patterns and enable more precise optimization. CLV to CAC Ratio compares customer lifetime value to customer acquisition cost—a ratio of 3:1 or higher is generally considered healthy. Time Between Purchases reveals the average interval between customer orders, enabling you to time win-back campaigns and reorder reminders precisely.
Revenue Per Cohort tracks how much revenue different customer cohorts generate over time, helping you identify which acquisition channels, campaigns, and customer segments are most valuable. RFM Segmentation divides customers into segments based on Recency (when they last purchased), Frequency (how often they purchase), and Monetary value (how much they spend), enabling targeted campaigns for each segment. Profit Per Order accounts for the cost of goods, fulfillment, and customer service, revealing which orders are actually profitable (some high-revenue orders may be unprofitable after accounting for all costs).
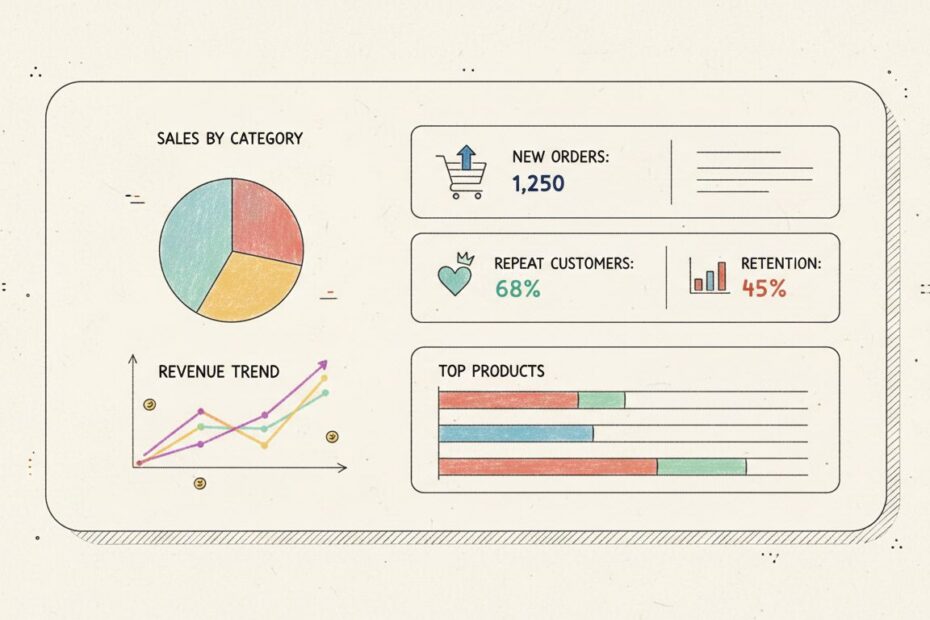
Implementing a Retention Metrics Dashboard
Tracking retention metrics is only valuable if you actually use the data to make decisions and optimize performance. Create a centralized dashboard that displays your core metrics—CLV, CRR, RPR, churn rate, AOV, NPS, and CES—with trend lines showing performance over at least 2-4 quarters. This dashboard should be accessible to your entire team and reviewed regularly in team meetings. Set clear targets for each metric based on industry benchmarks and your specific business goals.
For example: “Increase CLV from $168 to $250 within 12 months” or “Reduce monthly churn from 8% to 5% within 6 months.” Assign ownership for each metric to specific team members and hold them accountable for improvement. Use the dashboard to identify which metrics are trending negatively and investigate root causes. For example, if NPS drops suddenly, that’s a signal to investigate whether product quality has declined, customer service has deteriorated, or a recent change has created customer dissatisfaction.
Using Retention Metrics to Drive Action
Metrics are only valuable if they drive action. Use your retention metrics to inform strategic decisions across your entire organization. Product teams should use churn rate and NPS data to identify product quality issues and prioritize improvements. Marketing teams should use RPR and CLV by acquisition channel to identify which channels attract the most loyal, valuable customers and allocate budget accordingly.
Customer service teams should use NPS and CES data to identify service quality issues and implement training to improve satisfaction. Finance teams should use CLV and CAC data to evaluate the ROI of different customer acquisition and retention initiatives. Leadership should review retention metrics monthly and use them to set strategic priorities. For example, if CLV is stagnating while CAC is increasing, that signals the need to shift focus from acquisition to retention and loyalty initiatives.
The Role of Technology in Retention Metrics Tracking
Modern e-commerce brands require sophisticated technology platforms to track, analyze, and act on retention metrics at scale. Analytics platforms like Google Analytics, Shopify Analytics, and specialized e-commerce analytics tools provide visibility into customer behavior and retention metrics. Customer Data Platforms like Bloomreach unify customer data from all touchpoints—website, email, mobile app, social media, customer service, and more—creating a single customer view that enables accurate metric calculation and personalized retention campaigns. Email marketing platforms enable triggered, automated campaigns based on customer behavior (such as “cart abandonment” or “time to reorder” campaigns).
Loyalty program platforms manage points, rewards, and tier structures while tracking engagement and spending. CRM systems consolidate customer information and interactions, enabling personalized communication and service. Bloomreach stands out as the leading platform for e-commerce retention metrics and optimization, combining customer data unification with AI-driven predictive analytics, personalization, and omnichannel campaign orchestration.
Bloomreach enables you to identify at-risk customers before they churn, predict optimal times to reach out with personalized offers, and automatically deliver personalized retention campaigns across email, SMS, push notifications, and web—all based on real-time analysis of your retention metrics.
Common Mistakes in Retention Metrics Tracking
Many e-commerce brands make preventable mistakes that undermine their retention efforts. Tracking vanity metrics instead of business metrics—focusing on email open rates or click-through rates instead of retention rate or CLV. Inconsistent metric definitions across teams—different departments calculating retention rate differently, making it impossible to compare results.
Ignoring cohort analysis—treating all customers as a single group instead of segmenting by acquisition channel, product category, or demographic, missing insights about which customer groups are most valuable. Setting unrealistic targets—expecting to improve retention by 50% in one quarter when industry benchmarks suggest 5-10% annual improvement is more realistic.
Not acting on insights—tracking metrics but failing to use them to inform decisions and drive improvements. Focusing only on acquisition—optimizing for new customer growth while ignoring retention, leading to a “leaky bucket” where you constantly need new customers to offset churn. Neglecting leading indicators—focusing only on lagging indicators like churn (which you can’t change) instead of leading indicators like engagement (which you can influence today).
Benchmarking Your Performance Against Industry Standards
Understanding how your retention metrics compare to industry benchmarks helps you set realistic targets and identify where you’re outperforming or underperforming peers. Typical e-commerce benchmarks include: Customer Retention Rate of 85-95% annually, Repeat Purchase Rate of 20-40% (with 50%+ being exceptional), Customer Churn Rate below 5% monthly, Net Promoter Score of 30-50 (with 50+ being excellent), Average Order Value ranging from $40-$150+ depending on category, and Customer Lifetime Value averaging $150-$500+ depending on industry. However, these are just averages—your specific benchmarks depend on your industry, product category, price point, and business model.
A luxury goods brand might have lower repeat purchase rates but much higher CLV, while a consumables brand might have high repeat purchase rates but lower CLV. Use industry reports from Shopify, Stripe, and specialized e-commerce research firms to identify benchmarks specific to your category, then set targets that are 10-20% above current benchmarks as stretch goals.
Key Takeaway
Customer retention metrics are the quantifiable indicators that reveal how well your e-commerce business keeps customers coming back for repeat purchases and maximizes lifetime value. The seven core metrics—Customer Lifetime Value, Repeat Purchase Rate, Customer Retention Rate, Customer Churn Rate, Average Order Value, Net Promoter Score, and Customer Engagement Score—together provide comprehensive visibility into retention performance and enable data-driven optimization.
By tracking these metrics consistently, setting clear improvement targets, using them to inform strategic decisions across your organization, and leveraging modern technology platforms like Bloomreach to automate analysis and personalized retention campaigns, you’ll shift from a costly acquisition-focused model to a sustainable, profitable retention-focused model that builds long-term business value. The brands winning in e-commerce today aren’t those spending the most on customer acquisition—they’re those who have mastered the metrics and mechanics of retention.
Turn Metrics Into Profits
Understanding your retention metrics is the first step—transforming those insights into action is what separates winning e-commerce brands from the rest. Voxwise specializes in helping e-commerce brands analyze their retention metrics, identify optimization opportunities, and implement data-driven strategies that increase customer lifetime value and reduce churn.
Whether you need help setting up retention metric tracking, analyzing your current performance against benchmarks, designing loyalty programs, or implementing automated retention campaigns, our team has the expertise to guide you through every step.