How AI Helps Predict Customer Behavior in E-commerce
Traditional business analytics answers a single question: what happened to our sales last quarter? This reactive approach examines historical data after customer decisions are already made. Modern retail demands a different capability: what will this specific customer do in the next 24 hours, and how should we respond right now?

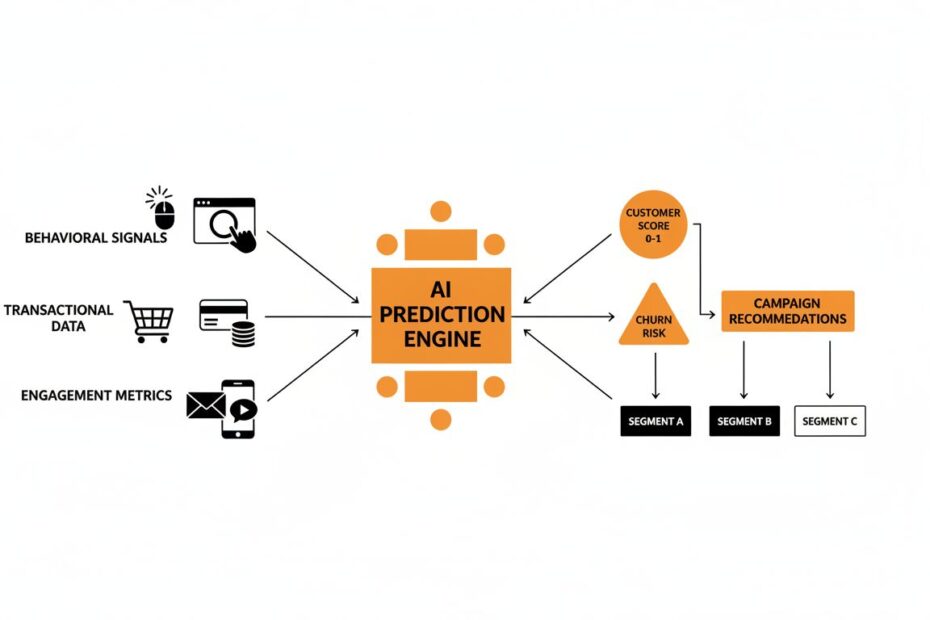
Predictive customer analytics powered by AI fundamentally transforms this equation. Instead of analyzing historical segments, machine learning models evaluate each customer’s real-time behavioral signals, historical purchase patterns, and engagement trends to forecast future actions with measurable accuracy. The difference is not theoretical. It directly increases conversion rates, protects profit margins, and reduces churn by 15-30% in most retail environments.
This shift from reactive reporting to predictive decisioning represents the most significant evolution in customer relationship management since the adoption of email marketing. The technology is no longer experimental. Bloomreach Predictions, powered by Loomi AI, demonstrates that unified predictive systems can integrate customer data, machine learning models, and multi-channel activation into a single operational platform.
Why Traditional Analytics Fails in Modern Retail
Static segmentation divides customers into broad buckets: “high-value,” “at-risk,” “new.” These segments remain fixed for weeks or months, missing rapid shifts in customer intent. A customer’s behavior can change dramatically between Monday and Friday, but traditional analytics cannot capture this velocity.
Machine learning operates in real time. When a customer adds a product to their cart, browses competitor pages, or stops opening emails, the predictive system immediately recalculates their propensity to purchase, churn risk, and optimal messaging strategy. This continuous re-evaluation is what separates predictive systems from static reporting tools.
Use Case Overview: Five Core Prediction Scenarios in E-commerce
Predictive AI creates measurable business value across five distinct use cases in retail and e-commerce. Each requires specific data inputs, precise campaign orchestration, and clear measurement criteria. When implemented together, they transform marketing from a cost center into a profit engine.
When This Use Case Matters
Predictive customer behavior analytics becomes essential when:
- Your customer base exceeds 50,000 active buyers. Manual analysis cannot scale to individual-level predictions across large populations.
- Customer behavior is volatile and seasonal. Retail environments experience rapid shifts in purchase intent driven by promotions, weather, holidays, and economic conditions.
- Churn is a material business problem. Proactive retention powered by churn prediction typically increases customer lifetime value by 20-40%.
- Your marketing team is resource-constrained. Predictive automation eliminates the need for manual A/B testing and constant campaign optimization.
- Your data exists across multiple systems. A unified CDP with native AI can stitch together fragmented data to create accurate individual-level predictions.
Most mid-market to enterprise retail brands face all five conditions simultaneously.
1. Scoring Immediate Purchase Intent via In-Session Prediction
What It Means
In-session prediction computes a probability score between 0 and 1 for each visitor currently browsing your site, representing their likelihood to complete a purchase before they close their browser. This is not a historical segment. It is a real-time calculation that updates continuously as the customer interacts with your website.
A score of 0.85 means the visitor has an 85% probability of purchasing in the next 30 minutes. A score of 0.25 means they are unlikely to convert during this session. The system generates these scores instantly based on live clickstream behavior combined with each customer’s historical patterns.
Required Data Inputs
In-session prediction requires five critical data signals:
- Live clickstream velocity: Pages viewed per minute, time spent on product detail pages, and navigation patterns
- Product evaluation signals: Specific product views, specification page reads, review section engagement, and comparison shopping behavior
- Cart interaction patterns: Items added to cart, removal frequency, and checkout page progression
- Historical conversion patterns: This customer’s past purchase frequency, average order value, and product category affinity
- Device and session context: Device type, traffic source, time of day, and previous session history
Bloomreach Predictions aggregates these signals in real time and automatically generates a propensity score for each active visitor.
Automated Campaign Execution
Once the in-session prediction model is deployed, marketing teams configure campaign rules:
- High-probability visitors (0.75-1.0): Display a subtle product recommendation overlay or offer free shipping to accelerate conversion
- Medium-probability visitors (0.40-0.75): Show a limited-time discount code to reduce purchase friction
- Low-probability visitors (0.0-0.40): Suppress overlays entirely to avoid annoying browsers who are unlikely to convert regardless
The system automatically routes each visitor into the appropriate campaign variant in real time. No manual segmentation, batch processing, lag between behavior and response.
Business Impact
Retailers implementing in-session prediction typically achieve:
- Session conversion rate lift of 12-28%: Conversion rates increase because the right offers reach the right customers at the exact moment of highest intent
- Reduced cart abandonment by 15-22%: Timely interventions prevent browsers from leaving without purchasing
- Revenue per visitor increase of 8-18%: Higher conversion rates directly increase top-line revenue per traffic unit
A mid-market fashion retailer with 100,000 monthly visitors and a 2% baseline conversion rate gains an additional 2,400-5,600 conversions monthly by implementing in-session prediction. At an average order value of $85, this translates to $204,000-$476,000 in incremental monthly revenue.
2. Anticipating Customer Churn Long Before Account Dormancy
What It Means
Churn prediction identifies customers showing early warning signs of disengagement before they actually stop buying. Traditional analytics flags a customer as “churned” only after they have been inactive for 60-90 days. Predictive models flag them after 7-14 days of behavioral decline, enabling proactive retention before the relationship deteriorates.
The difference is critical. A customer who has stopped opening emails but still visits your site weekly is not yet churned. But the pattern suggests declining engagement. Predictive models detect this subtle shift and trigger retention campaigns before the customer disappears entirely.
Required Data Inputs
Churn prediction requires historical behavioral data that reveals engagement trends:
- Purchase interval expansion: Increasing gaps between consecutive purchases (e.g., customer previously bought every 30 days, now every 60 days)
- Email engagement decline: Decreasing open rates, click-through rates, and email interaction frequency
- Website visit reduction: Declining session frequency, shorter time on site, and lower page view counts
- Mobile app disengagement: Decreasing app session duration, lower feature usage, and longer gaps between app opens
- Category affinity shifts: Reduced browsing in previously favored product categories
Bloomreach Predictions combines these signals into a churn risk score. Customers with scores above 0.65 are flagged for immediate retention action.
Automated Campaign Execution
Marketing teams configure retention workflows for at-risk customers:
- Tier 1 (churn risk 0.75-1.0): Enroll in exclusive VIP retention sequence featuring personalized product recommendations, early access to sales, and direct customer service outreach
- Tier 2 (churn risk 0.50-0.75): Trigger automated win-back email sequence with a limited-time 15% discount on their favorite product category
- Tier 3 (churn risk 0.25-0.50): Add to nurture campaign featuring content about new product launches and brand stories
The system automatically re-evaluates each customer’s churn score daily. If engagement improves, the customer exits the retention workflow. If decline continues, escalation triggers.
Business Impact
Brands implementing churn prediction typically achieve:
- Churn rate reduction of 15-30%: Proactive retention prevents customer departures that would otherwise occur
- Win-back conversion rate improvement of 40-60%: Early intervention converts at-risk customers before they fully disengage
- Customer lifetime value increase of 20-40%: Retained customers generate incremental revenue over their extended relationship
A subscription e-commerce brand with 10,000 active customers and a 5% monthly churn rate loses 500 customers monthly. Implementing churn prediction reduces this to 350-425 customers, preserving 75-150 customers monthly. At an average customer lifetime value of $1,200, this protects $90,000-$180,000 in annual revenue.
3. Projecting Predictive Customer Lifetime Value (pCLV) for Budget Allocation
What It Means
Predictive customer lifetime value (pCLV) forecasts the total net margin a customer will generate over a specified future window, typically 12-24 months. Unlike historical CLV, which measures past value, pCLV predicts future value based on early relationship behaviors.
A customer acquired through a paid search campaign with an initial order value of $150, a repeat purchase rate of 3 purchases per year, and a 24-month retention rate of 65% has a predicted CLV of approximately $975 ($150 initial plus $825 from repeat purchases). This score guides budget allocation decisions across channels.
Required Data Inputs
pCLV models require behavioral data from the customer’s first 30-60 days:
- Initial transaction value: First purchase amount and product category
- Purchase frequency signals: Time to second purchase, interval between early purchases, and repeat rate
- Acquisition channel source: Paid search, organic, social, email, affiliate, or direct traffic
- Product category affinity: Categories browsed, wishlisted, and purchased
- Engagement velocity: Email signup to first purchase time, email engagement rate, and site visit frequency
Bloomreach Predictions calculates pCLV automatically for each new customer based on their cohort’s historical performance plus individual behavioral signals.
Automated Campaign Execution
Marketing teams use pCLV scores to optimize acquisition and retention spending:
- High pCLV customers (predicted CLV >$1,500): Route to premium customer success team, offer exclusive loyalty benefits, and allocate higher retention budget
- Medium pCLV customers (predicted CLV $500-$1,500): Standard marketing automation and retention campaigns
- Low pCLV customers (predicted CLV <$500): Minimal retention investment, focus on referral incentives to acquire similar high-value customers
Additionally, pCLV scores flow back to ad networks (Google Ads, Meta, TikTok) to optimize acquisition targeting. Ad platforms learn to prioritize customers with high predicted lifetime value, improving return on ad spend.
Business Impact
Brands implementing pCLV-driven allocation typically achieve:
- Customer acquisition cost efficiency improvement of 20-35%: Smarter budget allocation targets high-value customer profiles
- Retention marketing ROI increase of 30-50%: High-value customers receive premium retention investment, protecting their lifetime value
- Overall marketing ROI improvement of 15-25%: Elimination of wasteful spending on low-value customer acquisition
An e-commerce brand spending $500,000 monthly on customer acquisition across channels gains measurable efficiency. A 25% ROI improvement translates to $125,000 in incremental profit monthly, or $1.5 million annually.
4. Strategic Margin Protection via Predictive Discount Affinity
What It Means
Discount affinity prediction determines whether a customer actually requires a promotional incentive to complete a purchase or if they are already highly likely to buy at full price. This distinction directly protects profit margins.
A customer with a high purchase probability (0.85) and a history of purchasing at full retail price does not need a discount to convert. Offering them a 15% discount wastes margin. A customer with a medium purchase probability (0.45) and a history of responding to discounts may require an incentive. The predictive system calculates the optimal offer level for each customer.
Required Data Inputs
Discount affinity prediction requires transactional and behavioral data:
- Historical promotional code usage: Percentage of purchases made with discount codes, redemption frequency by offer type, and discount sensitivity
- Full-price purchase history: Percentage of purchases at regular retail price and average order value without incentives
- Price filtering behavior: Frequency of browsing discount or sale sections, filtering by price range, and abandoned carts after price comparison
- Competitive browsing patterns: Time spent on competitor sites, comparison shopping behavior, and price sensitivity signals
- Current purchase probability: Real-time propensity score for this customer to convert
Bloomreach Predictions combines these signals into a discount affinity score that guides promotional strategy.
Automated Campaign Execution
Marketing teams configure offer rules based on discount affinity:
- High affinity for full price (affinity score 0.75-1.0): Send product recommendations and cart recovery emails with no discount
- Medium affinity (affinity score 0.40-0.75): Offer a limited-time 10% discount exclusively for abandoned carts
- High discount affinity (affinity score 0.0-0.40): Reserve 20-25% discounts for this segment, knowing they require incentives to purchase
The system automatically selects offer levels in real time. No manual decision-making. No broad-brush discounting that erodes margins across all customers.
Business Impact
Brands implementing discount affinity prediction typically achieve:
- Average order value increase of 8-15%: Fewer unnecessary discounts mean higher revenue per transaction
- Promotional campaign profitability increase of 20-35%: Discounts are reserved for price-sensitive segments, protecting margins
- Overall gross margin improvement of 2-4%: Margin protection compounds across thousands of daily transactions
A retailer with $10 million in annual revenue and a 40% gross margin ($4 million) gains a 3% margin improvement through discount affinity prediction. This translates to $300,000 in incremental annual profit with zero additional revenue growth.
5. Multi-Channel Optimization: Predicting Send Times and Preferred Channels
What It Means
Send-time optimization and channel preference prediction determine the exact moment and medium when each customer is most receptive to marketing messages. Instead of sending all emails at 9:00 AM, the system sends each customer’s email at their individual optimal time based on their historical engagement patterns.
A customer who typically opens emails at 7:00 PM on weekdays receives their promotional email at 7:00 PM. A customer who opens emails on Sunday mornings receives the same email on Sunday at 9:00 AM. This personalization increases open rates, click rates, and ultimately conversion rates.
Required Data Inputs
Send-time and channel optimization requires engagement history:
- Email open timestamps: Time of day, day of week, and device type when emails are opened
- SMS response patterns: Time windows when SMS messages are read and responded to
- Push notification engagement: Times when push notifications are opened and acted upon
- Website visit patterns: Time of day and day of week when customers visit your site
- Device preferences: Desktop vs. mobile usage patterns and preferred interaction channels
Bloomreach Predictions analyzes each customer’s historical engagement and automatically generates send-time predictions and channel preference scores.
Automated Campaign Execution
Marketing teams configure omni-channel workflows that respect individual timing:
- Email campaigns: System automatically sends each recipient their email at their optimal open time
- SMS messages: Queued for delivery during windows when the customer typically engages with SMS
- Push notifications: Triggered at optimal engagement times for mobile app users
- Web overlays: Displayed when customer is browsing, with timing adjusted based on historical session patterns
All channels work within a unified workflow, but each customer receives messages at their individual optimal time.
Business Impact
Brands implementing send-time optimization typically achieve:
- Email open rate increase of 15-25%: Sending at optimal times dramatically improves deliverability and engagement
- Email click-through rate increase of 10-20%: Higher engagement drives more clicks to product pages
- Overall email campaign conversion rate increase of 8-15%: Improved engagement translates to higher conversion
- Unsubscribe rate reduction of 20-35%: Timely, relevant messages reduce opt-out rates
An e-commerce brand sending 500,000 emails monthly at a 2% baseline click-through rate (10,000 clicks) gains a 15% improvement through send-time optimization. This results in 11,500 clicks monthly, or 1,500 incremental clicks. At a 3% conversion rate, this generates 45 incremental conversions monthly, or $3,825 in incremental revenue monthly at an $85 average order value.
Data, Tools, and Teams Involved
Essential Data Infrastructure for Predictive Models
| Data Layer | Source | Update Frequency | Prediction Impact |
|---|---|---|---|
| Customer Profile | CRM, CDP, Email Platform | Real-time | Central identity and attribute management for all models |
| Behavioral Events | Web Analytics, Mobile SDK, POS | Real-time | Session data, page views, product interactions for in-session prediction |
| Transactional History | E-commerce Platform, Order System | Real-time | Purchase data, order value, frequency for CLV and churn models |
| Engagement History | Email, SMS, Push, Web | Real-time | Open rates, click rates, send-time patterns for send-time optimization |
| Predictive Scores | AI Engine | Continuous | Purchase intent, churn risk, CLV, discount affinity for campaign activation |
| Campaign Response | Marketing Automation Platform | Real-time | Conversion tracking and model feedback for continuous learning |
Without real-time data synchronization across these layers, predictive accuracy deteriorates. Batch processing introduces lag that undermines the entire value proposition of predictive marketing.
Platform and Tool Requirements
An effective predictive customer behavior stack includes:
- Unified Customer Data Platform (CDP): Ingests data from all sources and maintains a real-time unified customer profile with complete behavioral history
- Predictive AI Engine: Bloomreach Predictions, powered by Loomi AI, is purpose-built for retail and e-commerce predictive use cases
- Email Service Provider: Must integrate bidirectionally with the CDP to enable send-time optimization and predictive segmentation
- SMS and Push Messaging: Required for omni-channel send-time optimization and channel preference prediction
- Web Personalization: Enables real-time in-session prediction deployment and dynamic content adjustment
- Analytics and Attribution: Measures prediction accuracy and campaign performance, feeding results back to the AI engine for continuous learning
Critically, these tools must be natively integrated, not connected via third-party APIs. Data lag between disconnected systems breaks the real-time decisioning model that makes predictive marketing valuable.
Team Structure and Responsibilities
| Role | Responsibility | Time Allocation |
|---|---|---|
| CRM Manager | Customer data quality, identity resolution, data governance | 50% |
| Marketing Operations Manager | Prediction model setup, segmentation creation, campaign configuration | 40% |
| Marketing Analyst | Prediction accuracy monitoring, campaign performance analysis, model optimization | 35% |
| Performance Marketing Manager | Budget allocation based on pCLV scores, channel strategy, ROI measurement | 40% |
| Email Marketing Manager | Campaign strategy, creative direction, send-time workflow configuration | 50% |
Predictive systems redistribute team responsibilities. Teams spend less time on manual analysis and testing, more time on strategic optimization and data quality. This shift requires organizational change management and clear role definition.
How Bloomreach Loomi AI Deploys Predictive Models at Scale
Bloomreach Predictions is a purpose-built platform for retail and e-commerce predictive use cases. Unlike generic marketing automation tools, Bloomreach natively combines customer data, predictive intelligence, and omni-channel activation into a single unified system.
Core Capabilities That Drive ROI
Native Prediction Templates: Bloomreach provides pre-built templates for the five most common retail use cases: purchase prediction, in-session prediction, churn prediction, CLV prediction, and discount affinity. Teams configure these templates rather than building models from scratch, reducing implementation time from months to weeks.
Real-Time Scoring: The platform scores each customer continuously as new behavioral data arrives. When a customer adds an item to their cart, clicks a product page, or opens an email, their prediction scores update instantly. This real-time evaluation is what enables in-session prediction and true omni-channel personalization.
Native Four-Group Testing Framework: Bloomreach includes a built-in testing structure that isolates prediction model accuracy from marketing campaign effectiveness. The system automatically creates four groups: high-probability with campaign, high-probability without campaign, low-probability with campaign, and low-probability without campaign. This structure proves whether the model is accurate and whether the marketing action drives incremental value.
Omni-Channel Activation: Predictions activate across all channels within a single unified workflow: email, SMS, push notifications, web overlays, and even ads. All channels read from the same prediction scores, ensuring consistent messaging and timing across customer touchpoints.
Continuous Learning: The platform measures campaign outcomes and automatically feeds results back to the prediction models. If a particular customer segment converts at higher rates than predicted, the model learns this pattern and adjusts future predictions. This continuous feedback loop improves accuracy over time.
Integration with Existing Systems
Bloomreach Predictions integrates seamlessly with existing tools:
- Email platforms: Bi-directional sync with Klaviyo, Iterable, Sailthru, and other major ESPs
- Analytics: Direct integration with Google Analytics, Segment, and custom data warehouses
- E-commerce platforms: Native connectors for Shopify, WooCommerce, BigCommerce, and custom platforms
- Advertising: Campaign orchestration across Google Ads, Meta, TikTok, and other ad networks
This flexibility means brands can implement Bloomreach Predictions without replacing their existing martech stack.
Common Architectural Pitfalls When Implementing Predictive Analytics
Mistake 1: Training Models on Siloed or Poor-Quality Data
Many brands attempt to build predictive models using fragmented data from disconnected systems. Email data lives in the ESP, behavioral data in analytics, transactional data in the e-commerce platform. Each system has its own customer identifier and update frequency.
The problem: Fragmented data creates inaccurate predictions. If the email system doesn’t know about yesterday’s purchase, the churn model cannot account for recent engagement. If the analytics system doesn’t sync with the CRM, the purchase prediction model misses critical behavioral signals.
The fix: Establish a clean customer data platform foundation before building predictive models. Ensure real-time data synchronization across all sources. Validate data quality continuously. Poor data quality is the number one reason predictive models fail in production.
Mistake 2: Treating Predictions as Static Lists Rather Than Dynamic Attributes
Many brands run prediction models once per month, generating a static list of “high-value customers” or “at-risk customers.” This batch approach misses the dynamic nature of customer behavior.
The problem: Customer intent changes hourly. A customer’s purchase probability might be 0.25 on Monday morning and 0.85 on Wednesday evening after viewing a specific product. Batch predictions cannot capture this velocity. By the time the monthly prediction runs, customer behavior has shifted dramatically.
The fix: Implement continuous scoring loops that update predictions in real time as customer data arrives. Bloomreach Predictions updates scores automatically whenever new behavioral data is ingested, ensuring that campaign decisions are always based on current intent, not stale historical data.
Mistake 3: Ignoring Prediction Accuracy Metrics
Some brands deploy prediction models without validating their accuracy. They assume the model is working because overall conversion rates improved. But improvement might come from better campaign creative, not better predictions.
The problem: Inaccurate predictions waste marketing budget on low-probability customers and miss opportunities with high-probability customers. Without measurement, teams cannot distinguish between model accuracy and campaign effectiveness.
The fix: Use Bloomreach’s native four-group testing framework to isolate prediction accuracy from campaign effectiveness. Run controlled tests that measure whether high-probability customers actually convert at higher rates than low-probability customers. Monitor prediction accuracy metrics continuously and adjust model parameters if accuracy declines.
How to Measure Predictive Model Success
Key Performance Indicators for Predictive Systems
Model Accuracy Metrics:
- Prediction accuracy: Percentage of customers who actually converted compared to those predicted to convert
- Lift: Percentage increase in conversion rate for high-probability customers vs. low-probability customers
- AUC (Area Under the Curve): Statistical measure of model discrimination ability, ranging from 0.5 (random) to 1.0 (perfect)
Business Impact Metrics:
- Revenue lift: Incremental revenue generated from predictive campaigns vs. control groups
- Conversion rate improvement: Percentage increase in overall conversion rates after predictive system deployment
- Customer lifetime value increase: Percentage improvement in CLV for customers acquired or retained via predictive campaigns
- Churn rate reduction: Percentage decrease in customer churn after churn prediction implementation
Operational Metrics:
- Campaign setup time: Hours required to launch a new predictive campaign (should decrease as team gains expertise)
- Model refresh frequency: How often prediction scores update (should be real-time or near-real-time)
- Data latency: Hours between a customer action and profile update (should be less than 1 hour)
- Team efficiency: Hours per week spent on manual analysis vs. automated optimization (should shift toward optimization)
Measurement Framework
Establish a baseline before implementing predictive systems. Then measure continuously, not monthly:
- Week 1-4: Implement data infrastructure and prediction models. Validate data quality and model accuracy.
- Week 5-8: Launch first predictive campaigns. Measure campaign performance vs. control groups using four-group testing.
- Week 9-12: Analyze results, refine model parameters, optimize budget allocation.
- Month 4+: Scale successful campaigns, test new prediction use cases, measure cumulative ROI.
Most brands see measurable improvement within 90 days. Significant impact (2x plus conversion lift) typically appears within 6 months as data accumulates and models improve.
How Voxwise Helps Deploy Predictive Customer Behavior Systems
Voxwise is a B2B consulting and implementation firm specializing in CRM, customer engagement, and customer data strategy for retail and e-commerce brands. We help brands design and implement predictive customer behavior systems that increase profitability.
Our Approach
Assessment: We audit your current marketing stack, data infrastructure, and team capabilities. We identify gaps preventing accurate predictions and opportunities for immediate impact.
Strategy Development: We design a predictive customer behavior strategy tailored to your specific business problems, whether that is churn, acquisition, or revenue per customer.
Implementation: We implement the technical infrastructure (CDP, prediction models, integrations) and configure campaigns. We train your team to operate and optimize the system.
Optimization: We monitor prediction accuracy, refine models, and continuously improve ROI. We provide monthly business reviews with actionable insights.
Why Voxwise
- Retail expertise: We specialize in retail and e-commerce, not generic B2B marketing
- Bloomreach partnership: We are a certified Bloomreach implementation partner with deep expertise in Predictions and Loomi AI
- Proven methodology: Our clients consistently achieve 2-3x improvements in conversion rates and 20-40% improvements in retention
- Team augmentation: We work as an extension of your team, not as a separate vendor
If you are evaluating predictive customer behavior systems or considering a Bloomreach implementation, Voxwise can help you navigate the complexity and accelerate time to value.
Conclusion
Predictive customer behavior analytics represents a fundamental shift from reactive reporting to proactive decisioning. The brands that implement this transformation effectively will see measurable improvements in conversion rates, customer retention, and marketing ROI.
The technology is mature and proven. The real challenge is organizational: aligning data infrastructure, establishing accurate prediction models, and building team capability to operate a more sophisticated system.
Voxwise helps retail and e-commerce brands navigate this transition. We combine strategic guidance with technical implementation expertise to ensure your predictive customer behavior investment delivers real business value.
Frequently Asked Questions
Q: How exactly does AI predict a customer’s future buying behavior?
A: AI analyzes historical customer data (past purchases, browsing patterns, email engagement) combined with real-time behavioral signals (current session activity, recent interactions) to identify patterns that correlate with specific future actions. Machine learning models learn which patterns indicate high purchase probability, churn risk, or discount sensitivity. The model then scores each customer on these dimensions, generating a probability score between 0 and 1 for each prediction outcome.
Q: What is the difference between descriptive customer analytics and predictive customer analytics?
A: Descriptive analytics answers “What happened?” by analyzing historical data. Predictive analytics answers “What will happen?” by using machine learning to forecast future customer actions. Descriptive analytics tells you that 5% of customers churned last month. Predictive analytics identifies which customers will churn next month, enabling proactive retention before they leave.
Q: What specific customer data inputs are mandatory to run a reliable purchase prediction model?
A: Purchase prediction requires: historical purchase frequency and order value, browsing behavior and product category affinity, email engagement patterns, current session activity (pages viewed, time on site), acquisition channel source, and recency of last purchase. The minimum data requirement is typically one month of historical data, though more data improves accuracy. Bloomreach requires customers to have had at least one session in the last 90 days to be eligible for prediction.
Q: How does an e-commerce brand use in-session prediction to decrease cart abandonment?
A: In-session prediction scores each visitor’s likelihood to purchase during their current browsing session. Visitors with high purchase probability (0.75 plus) receive targeted interventions like product recommendations or free shipping offers to accelerate conversion. Visitors with low purchase probability receive no overlay, avoiding friction that might annoy browsers. This targeted approach increases conversion rates among high-intent visitors while respecting the browsing experience for low-intent visitors.
Transform Your Customer Insights Into Revenue
Predictive customer behavior analytics represents a highly advanced stage of CRM maturity. If you are evaluating this capability, Voxwise can help you assess your current data infrastructure and design a predictive system tailored to your business.
Discover whether your current data quality and team capability can support predictive customer behavior systems. Our CRM maturity assessment evaluates your data infrastructure, predictive readiness, and immediate opportunities for impact.
Speak with a Voxwise customer engagement strategist about implementing predictive customer behavior systems for your retail or e-commerce business.